Peter Mooney
Published: May 5, 2014 12:26 pm ET
Updated: May 5, 2014 12:30 pm ET
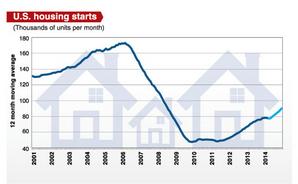
Image By: Plastics News graphic by Jessica Jordan
Statisticians inform us all data series have four primary components �� trend, cycle, seasonal and irregular forces at play. With key United States economic data becoming available relative to the first quarter of 2014, we are in a good position to parse them from that perspective and perhaps speculate as to the likely pattern of economic growth for the whole year 2014.
Taking seasonal and irregular factors together, winter weather always delivers a mix of negative and positive effects on the nation��s output. We have well-established econometric programs to seasonally adjust monthly and quarterly data.
Obviously the weather this past winter was unusually severe. National and international economists have been steadily reducing their estimates for U.S. economic growth in the first quarter of 2014 due to the disruptions caused by these ��irregular�� weather patterns. Demand across many product and service categories was dampened. However, the bad weather is now largely behind us, and manufacturers and service providers should benefit from pent-up demand as the spring thaw lifts spirits.
As for cyclical effects the business cycle is eternal. Yet the timing of its peaks and troughs vary in amplitudes. One example is the time it takes to recover from recessions.
From the 1950s to the 1990s there were four major recessions. Once these recessions ended, the cumulative growth of real U.S. GDP over the subsequent three years ranged between 10.4 percent and 15.8 percent. This translates to an annual average of 4.4 percent. Over the three years subsequent to the 2008-2009 recession, cumulative U.S. real GDP grew only 6.7 percent.
In fact from the end of the Great Recession in mid-2009 to the last quarter of 2013 annualized U.S. real GDP growth has averaged a fairly uniform 2.5 percent.
Economists and business analysts differ in their assessment of what lies ahead. Some suggest we��ve entered a ��new economy,�� although they differ as to the factors behind it.
However, what every business manager knows is from the Sept. 11 terror attacks in 2001 to the
financial crisis of 2008-2009 to the numerous geopolitical issues we confront today, it��s obvious the world has become an increasingly complicated and uncertain place. It��s not possible for business managers to ignore this new reality in their strategic planning.
Other economists and business analysts suggest that after the slow start to 2014 things will improve as the year unfolds, and for the year as a whole growth could be of the order of 3 percent. They are seldom clear as to the fortuitous forces producing this result. Their premise seems to be some way, somehow the economy will return to the sort of growth experienced in the past. This premise is unpersuasive.
One is on far firmer ground speculating on future economic growth based on trends in evidence over the recent past. The graph to the right portrays the trends of growth in the five major constituents of U.S. real GDP over the period 2010-2013.
One can generate from these data average annual sectoral contributions to GDP growth. I apply these sectoral contribution percentages to my own estimates for growth in the individual sectors in 2014, and I add up the various contributions. In this way I arrive at a range of estimates for real GDP growth here in 2014.
I regard recent trends in four of the five components of GDP as essentially locked-in; I don��t see forces on the horizon shifting these growth rates measurably in either direction. It��s the fifth component of GDP �� residential and non-residential investment �� that I believe constitutes ��the hinge of fate�� for the U.S. economy here in 2014.
I��m concerned about the slow recovery in the housing market since mortgage rates have gone up and lending conditions have stiffened.
In 2013, much of mortgage lending was for refinancing existing mortgages, not purchasing new or existing housing. The positive spin is there were so few housing starts during and immediately after the Great Recession there must be huge pent-up demand. However, much of the pent-up demand would normally come from new household formation �� young people completing their education, marrying, saving and looking for a home.
Sadly many young adults don��t have jobs, they��re still living with their parents and their marriage prospects are poor. The data suggest there have been many millions fewer household formations than normal since the recession hit.
I��m equally concerned about the recent trend of non-residential investment in factories, offices, warehouses, hospitals and other structures. In 2009, real U.S. non-residential investment declined by 19 percent. It rebounded, yet it only surpassed the 2007 level in real terms in 2013. To put this in perspective at the same time U.S. real non-residential investment was increasing by a net 1.8 percent cumulatively from 2007 to 2013 the U.S. population increased by 5.3 percent.
The graph above suggests if overall investment increases at roughly the same rate as in 2013, then GDP will probably grow 2.3 percent. If instead residential and non-residential investors are more bullish and overall investment grows by 10 percent, that would spur GDP growth to 3.1 percent.
Federal government spending spiked in 2009 as a result of the so-called stimulus (so-called insofar as it wasn��t designed to grow the economy, and it didn��t).
Since 2009, total federal, state and local government spending has barely budged (0.1 percent on average) over the past four years. The federal government actually added to economic headwinds by raising taxes, business paperwork requirements and health care costs. At a time when the burden of government should have been lessened to let the natural recuperative power of the marketplace manifest itself, it erected barriers to growth instead.
The administration has placed a lot of emphasis on growing the economy through international trade. However, over the first few months of 2014, the U.S. trade balance has deteriorated. When U.S. exports declined in February, it triggered another spate of downward revisions to first quarter growth estimates. For the whole year real growth in both trade categories could trend around 1 percent. The growth of imports would offset the modest positive contribution from the growth of exports.
At the end of the day, the factor of greatest salience for U.S. living standards is the growth of potential U.S. real GDP. This is in essence a function of two long-term trends �� namely, productivity improvement and the increase of the labor force. Whereas in the past U.S. productivity improved around 2.5 percent annually, here in the ��new economy�� it is advancing at a rate of around 1.5 percent.
The U.S. labor force used to grow 1 to 2 percent each year. Over the period 2002-2012 it grew at only a 0.7 percent rate, and the Bureau of Labor Statistics projects it growing 0.5 percent out to 2022.
The combination of these two vital statistics yields a potential growth rate of around 2 percent. One or both of these variables would have to experience a quantum leap in order to push U.S. economic growth back to the 3 to 4 percent of ��the old normal.��
��So we beat on, boats against the current�� (from the book, ��The Great Gatsby��). I personally remain upbeat for my own business and that of my customers in the plastics industry. My point is if we are to attain escape velocity from this abnormally long, subpar recovery it��s important we clearly explain how ��normal�� growth is to be restored. |